# D3
From the course: Learning Data Visualization with D3.js
https://bl.ocks.org/mbostock
https://github.com/planetoftheweb/d3/tree/master
https://raybo.org/
# Using D3 Selections
# Selecting the DOM
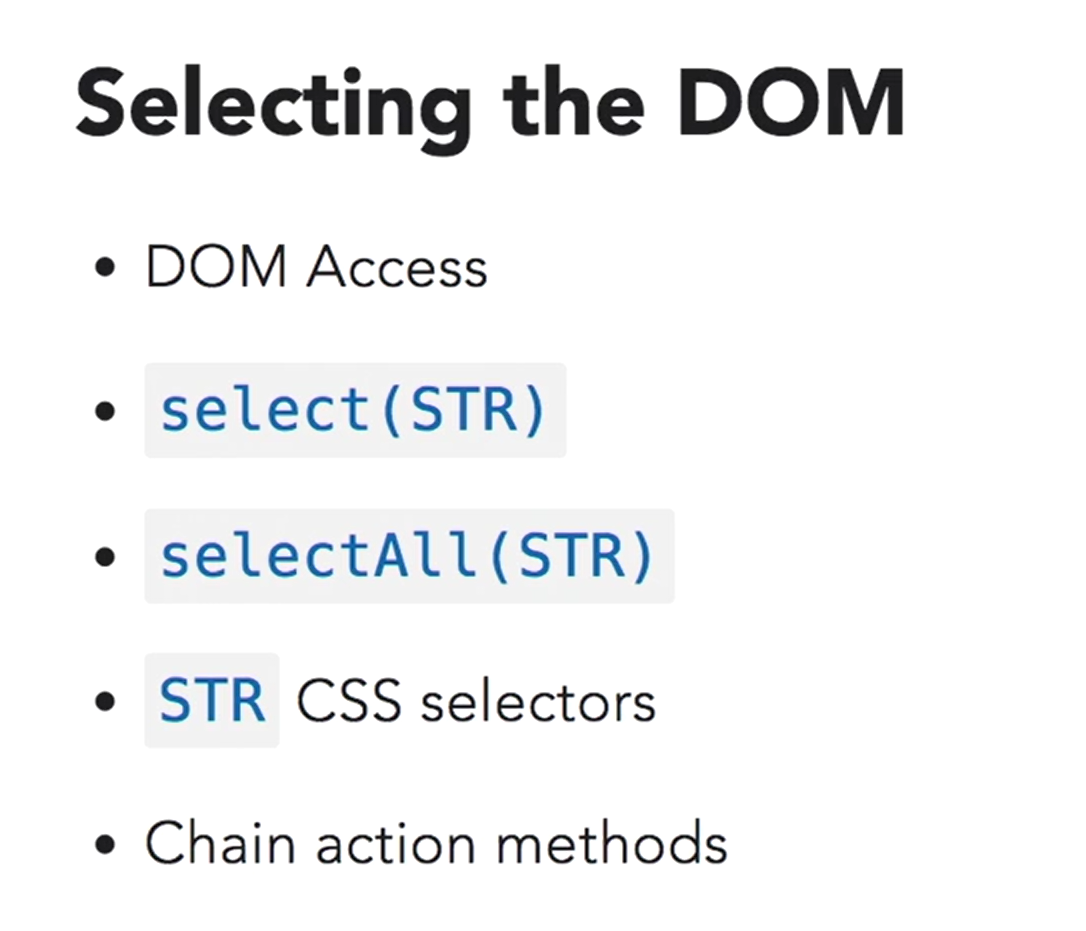
Now, D3 comes with selectors for DOM elements. The DOM, of course, is the Document Object Model, or the structure of any HTML page. If you've used CSS before, you should be familiar with how to target DOM elements by using CSS selectors. There are two D3 methods for selecting DOM elements. The first is called select and then you add a string of selectors, so this should be in quotes. select will choose the first element in the DOM that matches the CSS selector string that you specify. selectAll, in contrast, will return something that looks like an array of elements. its not exactly an array and you can't do all the things that you can do with Javascript to that array-like element, but it pretty much works like one. Once you have a selection, it can be automatically acted upon by passing other D3 methods. The string you specify is any CSS selector that you're used to working with to target an element. So, this is just like using a querySelector or querySelectorAll in Javascript or the dollar sign selector in JQuery. Now, this only selects the element and in order to do something with them, you'll need to use a variety of methods that D3 provides. Once such method is the text method, which replaces the text of the element with whatever you type in there. We'll take a look at that in just a minute. The nice thing about D3 is that you can chain the selectors together to form complex commands.
The Classes .temp and .day-high
<template>
<body>
<div>
<h2>Weather Forecast: <span class="small">Orlando</span></h2>
<table class="SimpleTable">
<thead>
<tr class="head">
<th scope="col" class="head-date">Date</th>
<th scope="col" class="head-temp-low">Low</th>
<th scope="col" class="head-temp-high">High</th>
</tr>
</thead>
<tbody>
<tr class="day">
<th scope="row" class="day-date">03/30/2017</th>
<td class="day-low"><span class="temp">87</span>°</td>
<td class="day-high"><span class="temp">68</span>°</td>
</tr>
<tr class="day">
<th scope="row" class="day-date">03/30/2017</th>
<td class="day-low"><span class="temp">64</span>°</td>
<td class="day-high"><span class="temp">85</span>°</td>
</tr>
<tr class="day">
<th scope="row" class="day-date">04/01/2017</th>
<td class="day-low"><span class="temp">65</span>°</td>
<td class="day-high"><span class="temp">89</span>°</td>
</tr>
<tr class="day">
<th scope="row" class="day-date">04/02/2017</th>
<td class="day-low"><span class="temp">69</span>°</td>
<td class="day-high"><span class="temp">90</span>°</td>
</tr>
<tr class="day">
<th scope="row" class="day-date">04/03/2017</th>
<td class="day-low"><span class="temp">65</span>°</td>
<td class="day-high"><span class="temp">88</span>°</td>
</tr>
</tbody>
</table>
<div id="viz"></div>
</div> <!-- container -->
</body>
</template>
2
3
4
5
6
7
8
9
10
11
12
13
14
15
16
17
18
19
20
21
22
23
24
25
26
27
28
29
30
31
32
33
34
35
36
37
38
39
40
41
42
43
44
Weather Forecast: Orlando
| Date | Low | High |
|---|---|---|
| 03/30/2017 | 87° | 68° |
| 03/30/2017 | 64° | 85° |
| 04/01/2017 | 65° | 89° |
| 04/02/2017 | 69° | 90° |
| 04/03/2017 | 65° | 88° |
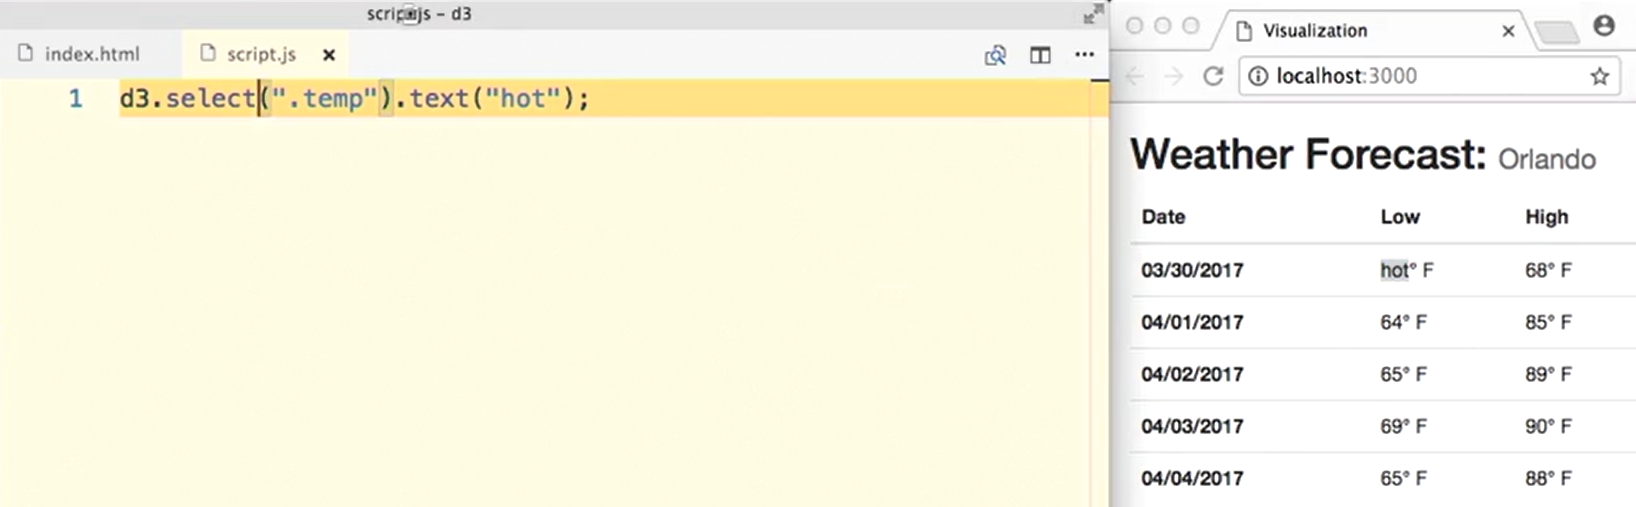
# Selecting one Temperature:
<script>
import * as d3 from "d3";

export default {
    mounted: function () {
        d3.select(".SelectOneTemperature .temp").text("hot");
    }
}
</script>
2
3
4
5
6
7
8
9
Weather Forecast: Orlando
| Date | Low | High |
|---|---|---|
| 03/30/2017 | 87° | 68° |
| 03/30/2017 | 64° | 85° |
| 04/01/2017 | 65° | 89° |
| 04/02/2017 | 69° | 90° |
| 04/03/2017 | 65° | 88° |
# Selecting All Temperatures:
<script>

import * as d3 from "d3";

export default {
    mounted: function () {
        d3.selectAll(".SelectOneTemperature .temp").text("hot");
    }
}
</script>
2
3
4
5
6
7
8
9
10

Weather Forecast: Orlando
| Date | Low | High |
|---|---|---|
| 03/30/2017 | 87° | 68° |
| 03/30/2017 | 64° | 85° |
| 04/01/2017 | 65° | 89° |
| 04/02/2017 | 69° | 90° |
| 04/03/2017 | 65° | 88° |
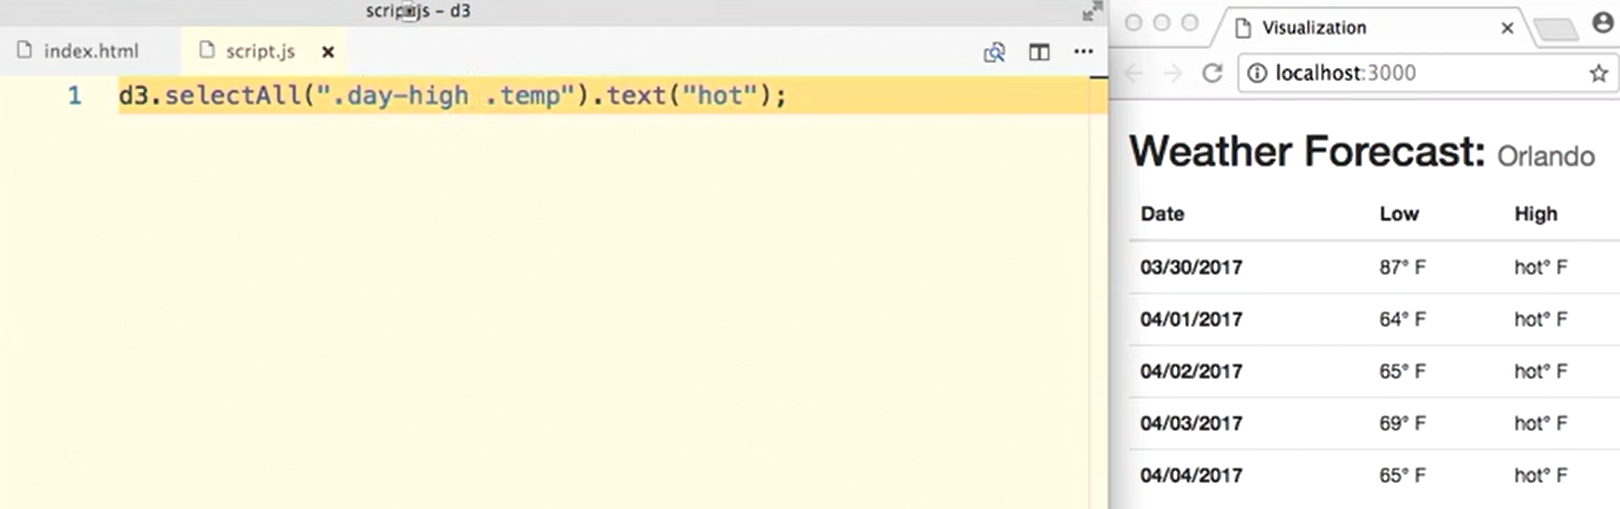
# Selecting High Temperatures:
<script>

import * as d3 from "d3";

export default {
    mounted: function () {
        d3.selectAll(".SelectHighTemperatures .day-high .temp").text("hot");
    }
}
</script>
2
3
4
5
6
7
8
9
10
Weather Forecast: Orlando
| Date | Low | High |
|---|---|---|
| 03/30/2017 | 87° F | 68° F |
| 03/30/2017 | 64° F | 85° F |
| 04/01/2017 | 65° F | 89° F |
| 04/02/2017 | 69° F | 90° F |
| 04/03/2017 | 65° F | 88° F |
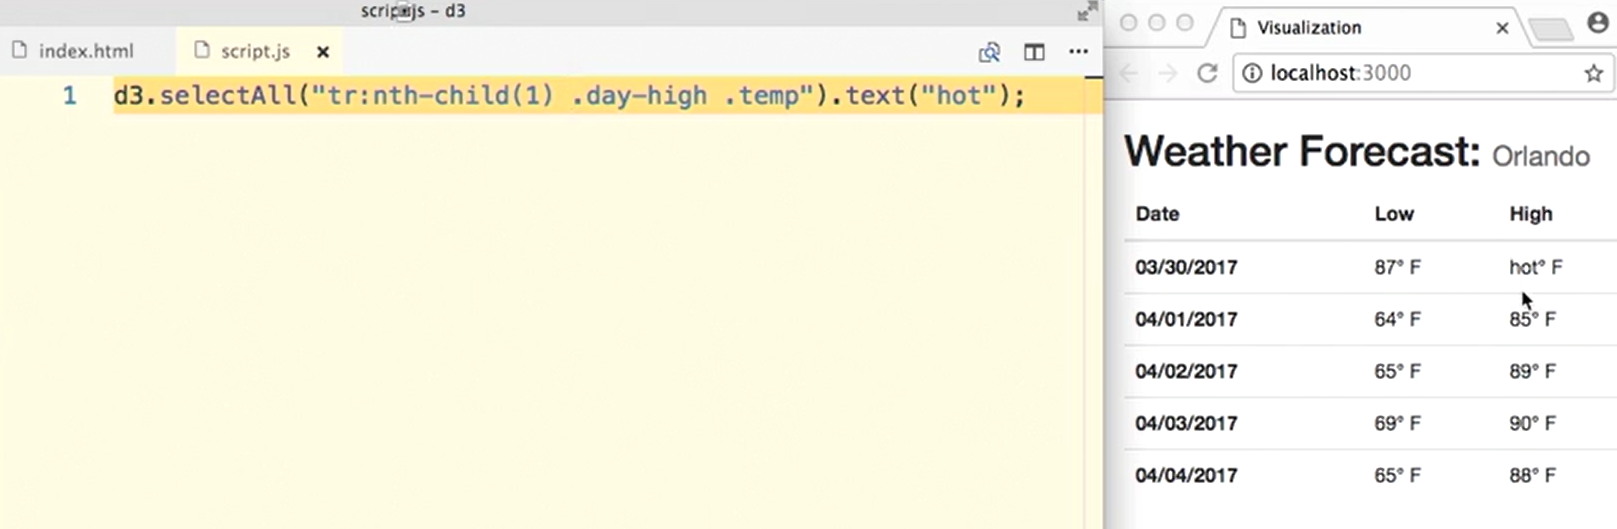
# Selecting a Child
<script>

import * as d3 from "d3";

export default {
    mounted: function () {
        d3.selectAll(".SelectChild tr:nth-child(1) .day-high .temp").text("hot");
    }
}
</script>
2
3
4
5
6
7
8
9
10
Weather Forecast: Orlando
| Date | Low | High |
|---|---|---|
| 03/30/2017 | 87° F | 68° F |
| 03/30/2017 | 64° F | 85° F |
| 04/01/2017 | 65° F | 89° F |
| 04/02/2017 | 69° F | 90° F |
| 04/03/2017 | 65° F | 88° F |
# Selecting a Even
<script>

import * as d3 from "d3";

export default {
    mounted: function () {
        d3.selectAll(".SelectChildEven tr:nth-child(even) .day-high .temp").text("hot");
    }
}
</script>
2
3
4
5
6
7
8
9
10
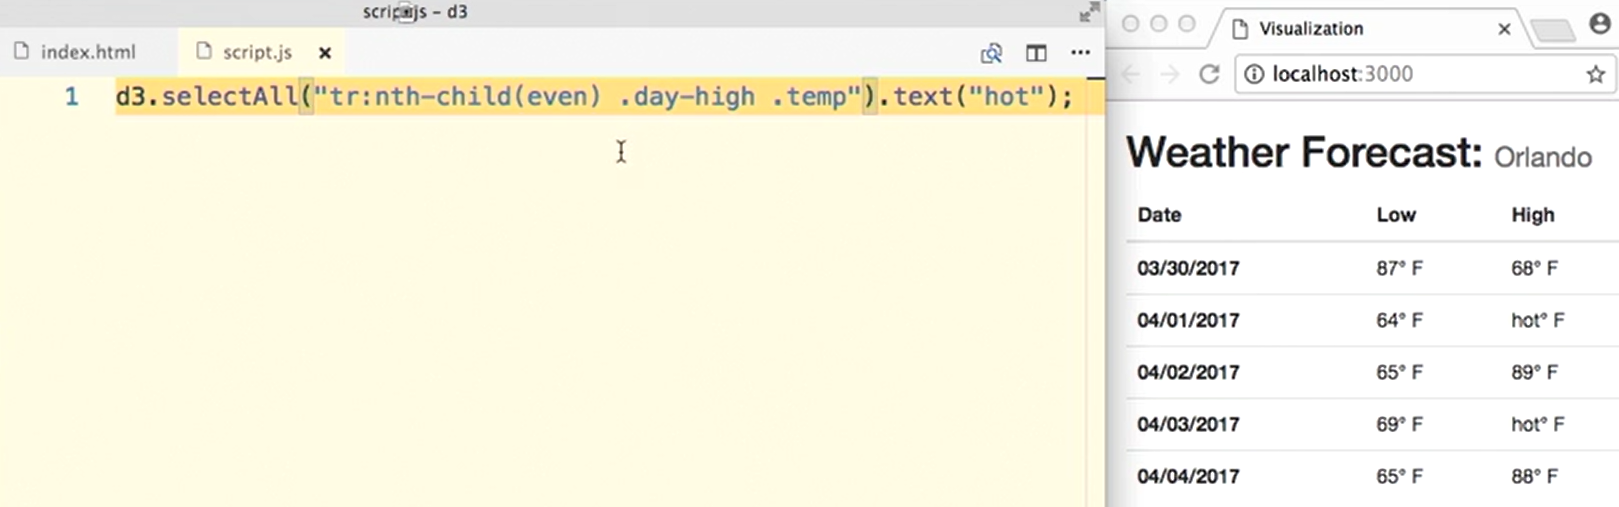
Weather Forecast: Orlando
| Date | Low | High |
|---|---|---|
| 03/30/2017 | 87° F | 68° F |
| 03/30/2017 | 64° F | 85° F |
| 04/01/2017 | 65° F | 89° F |
| 04/02/2017 | 69° F | 90° F |
| 04/03/2017 | 65° F | 88° F |
# Modifying Elements
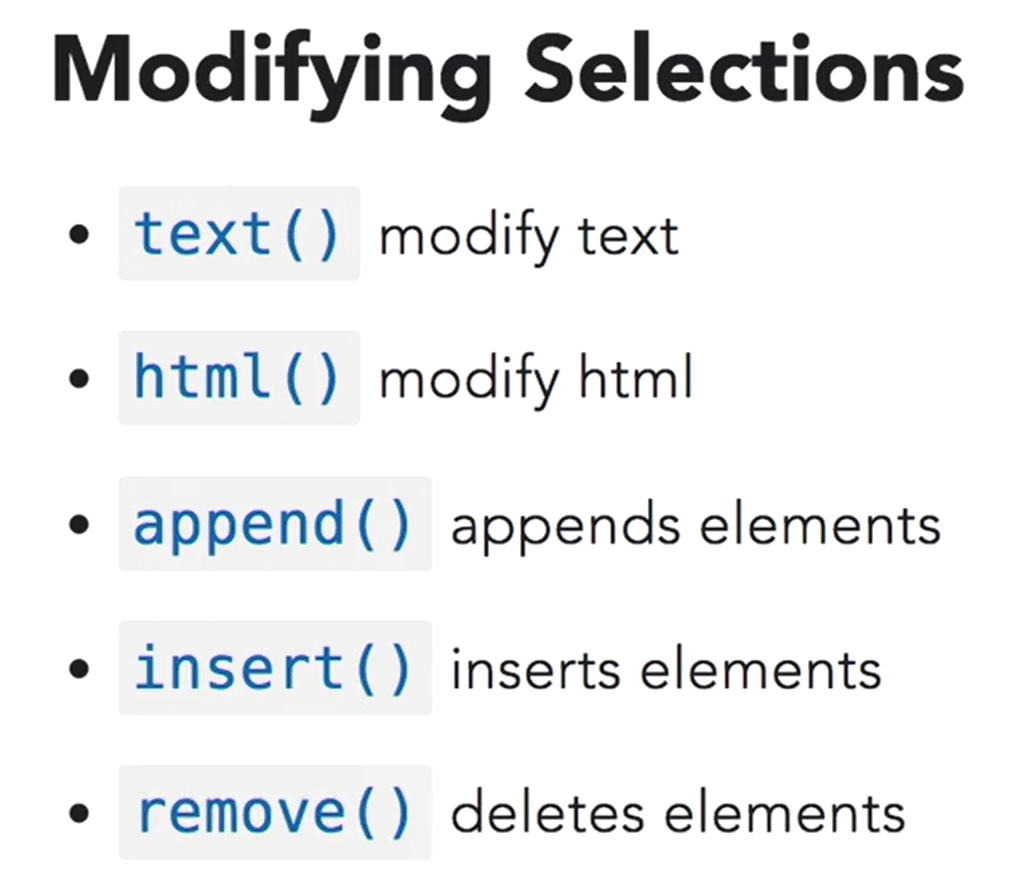
Although learning to select content is important, its what you do with that content or that selection that makes an impact. So, lets take a look at some of the methods that you can use to act upon elements.
We've already seen the text element, which is the simplest way to change the text of a selection.
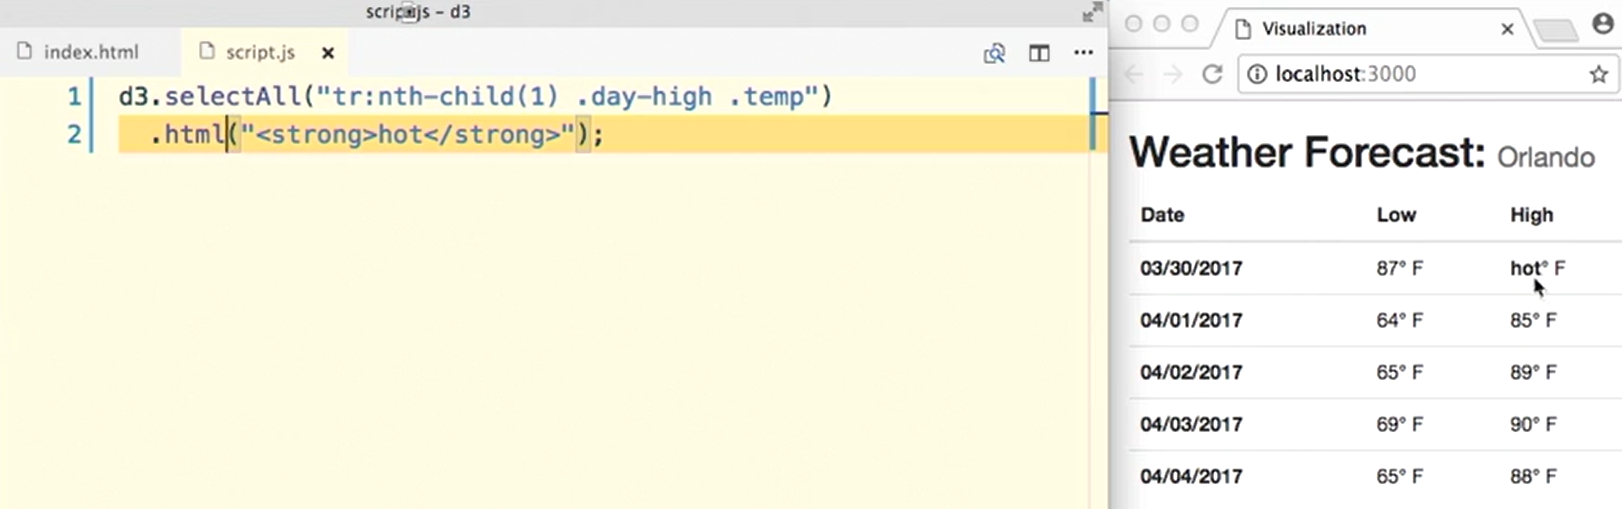
But it doesn't really allow you to use HTML, so if you need to do that, you'll need to use the HTML method, which lets you use more complex HTML tags.
Modifying HTML:
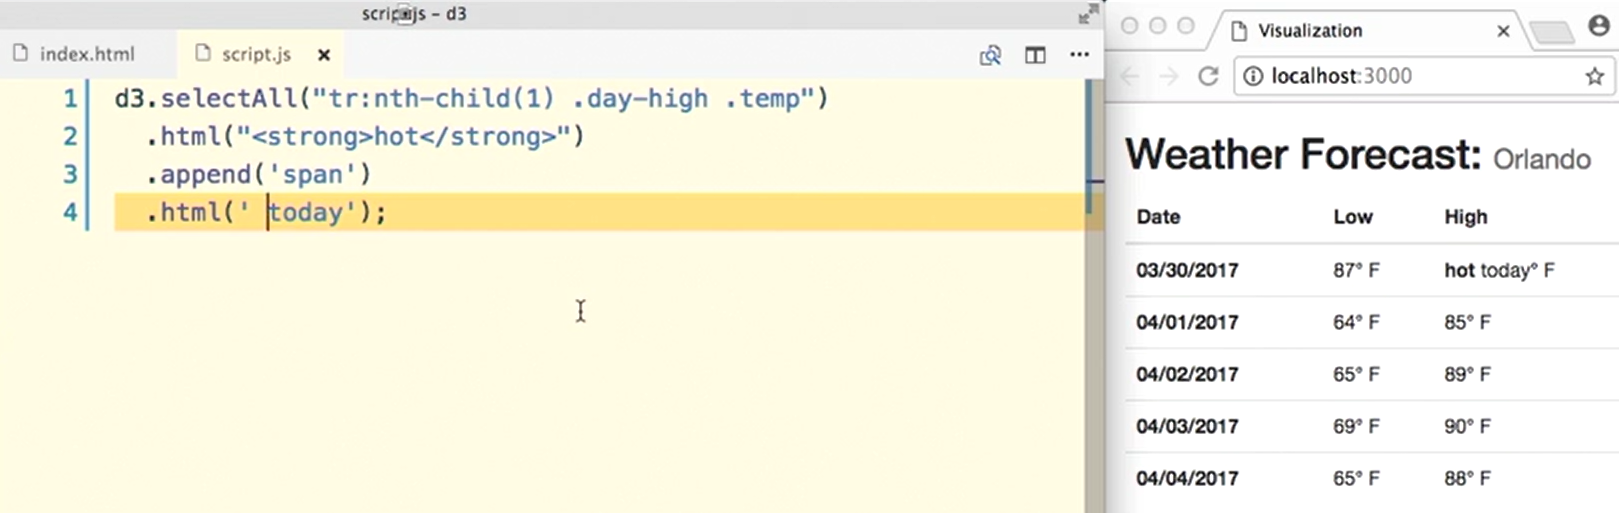
Append:
The append method allows you to add another element to the last child of the current selection.
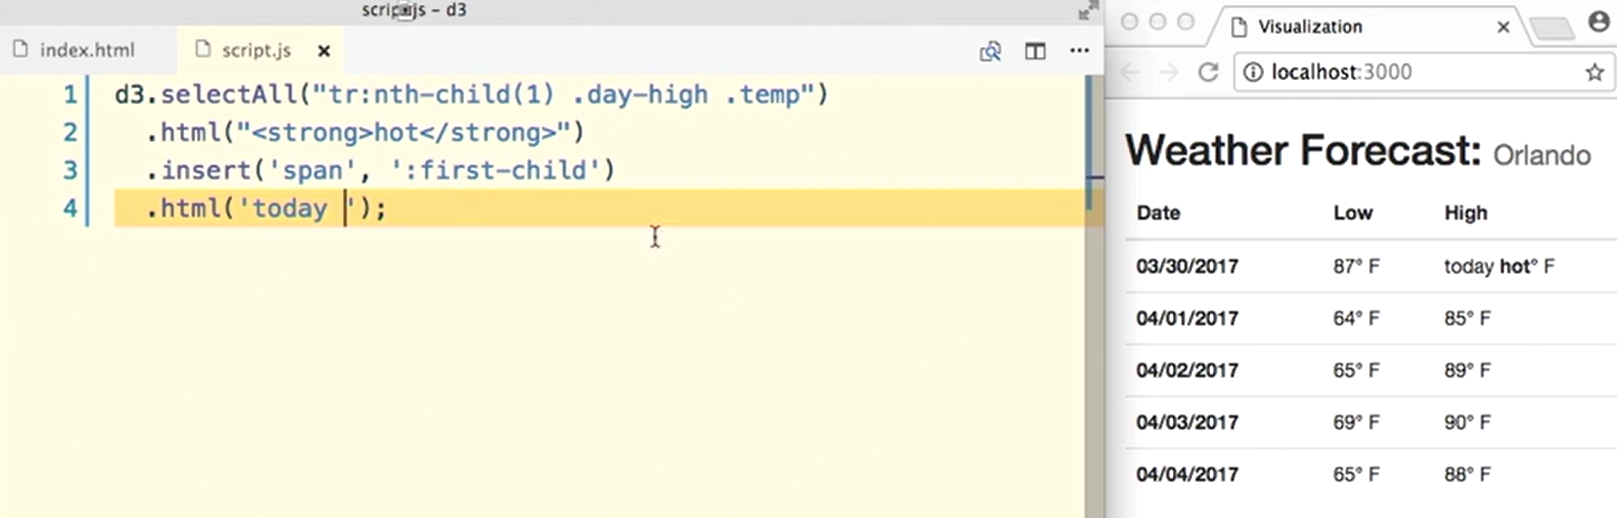
Insert:
And the insert method is a little bit more precise. It allows you to add an element to a more specific position within the selection.
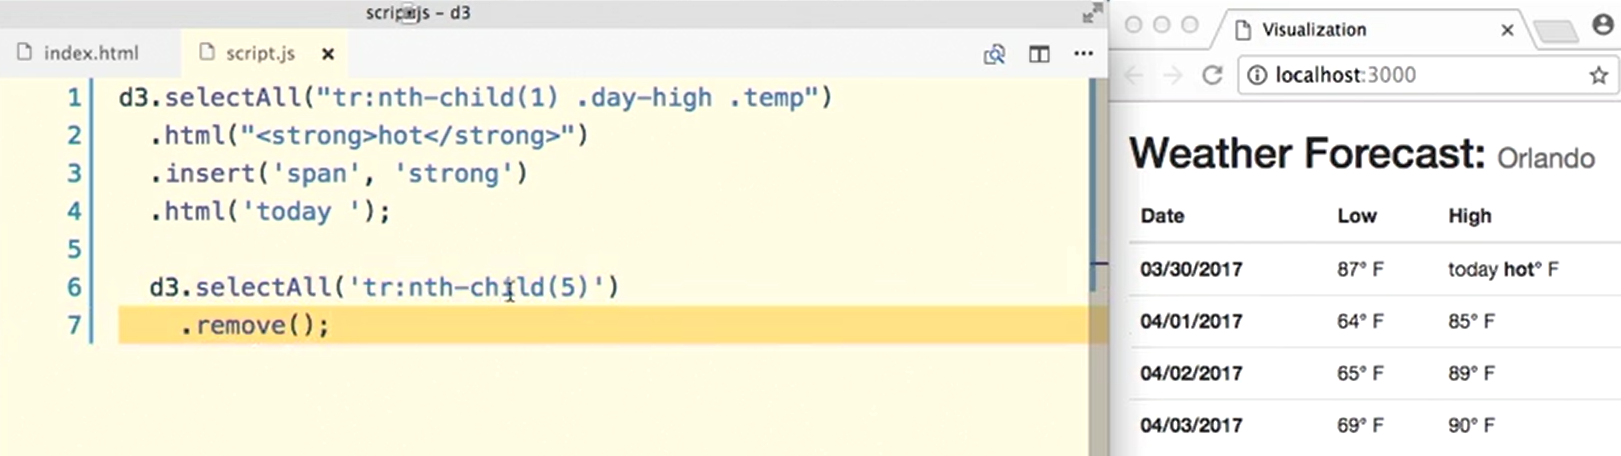
Remove:
Finally, of course, since you can append and insert elements, you can also remove them.
# Modifying attributes through CSS
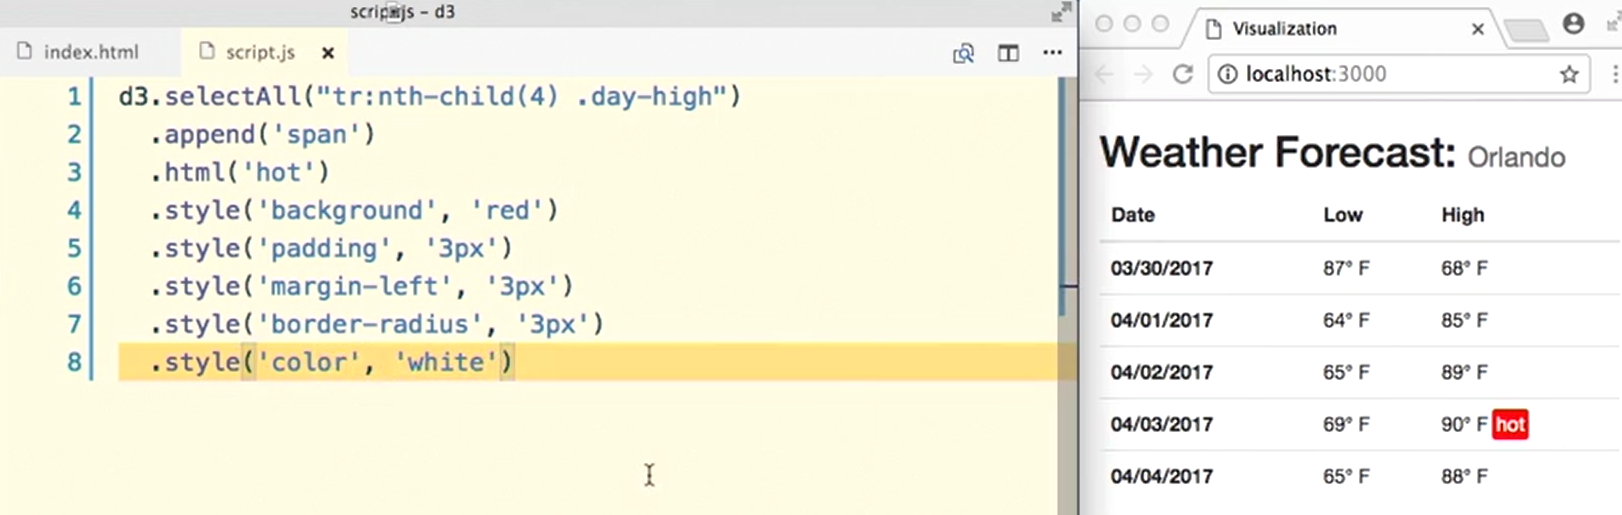
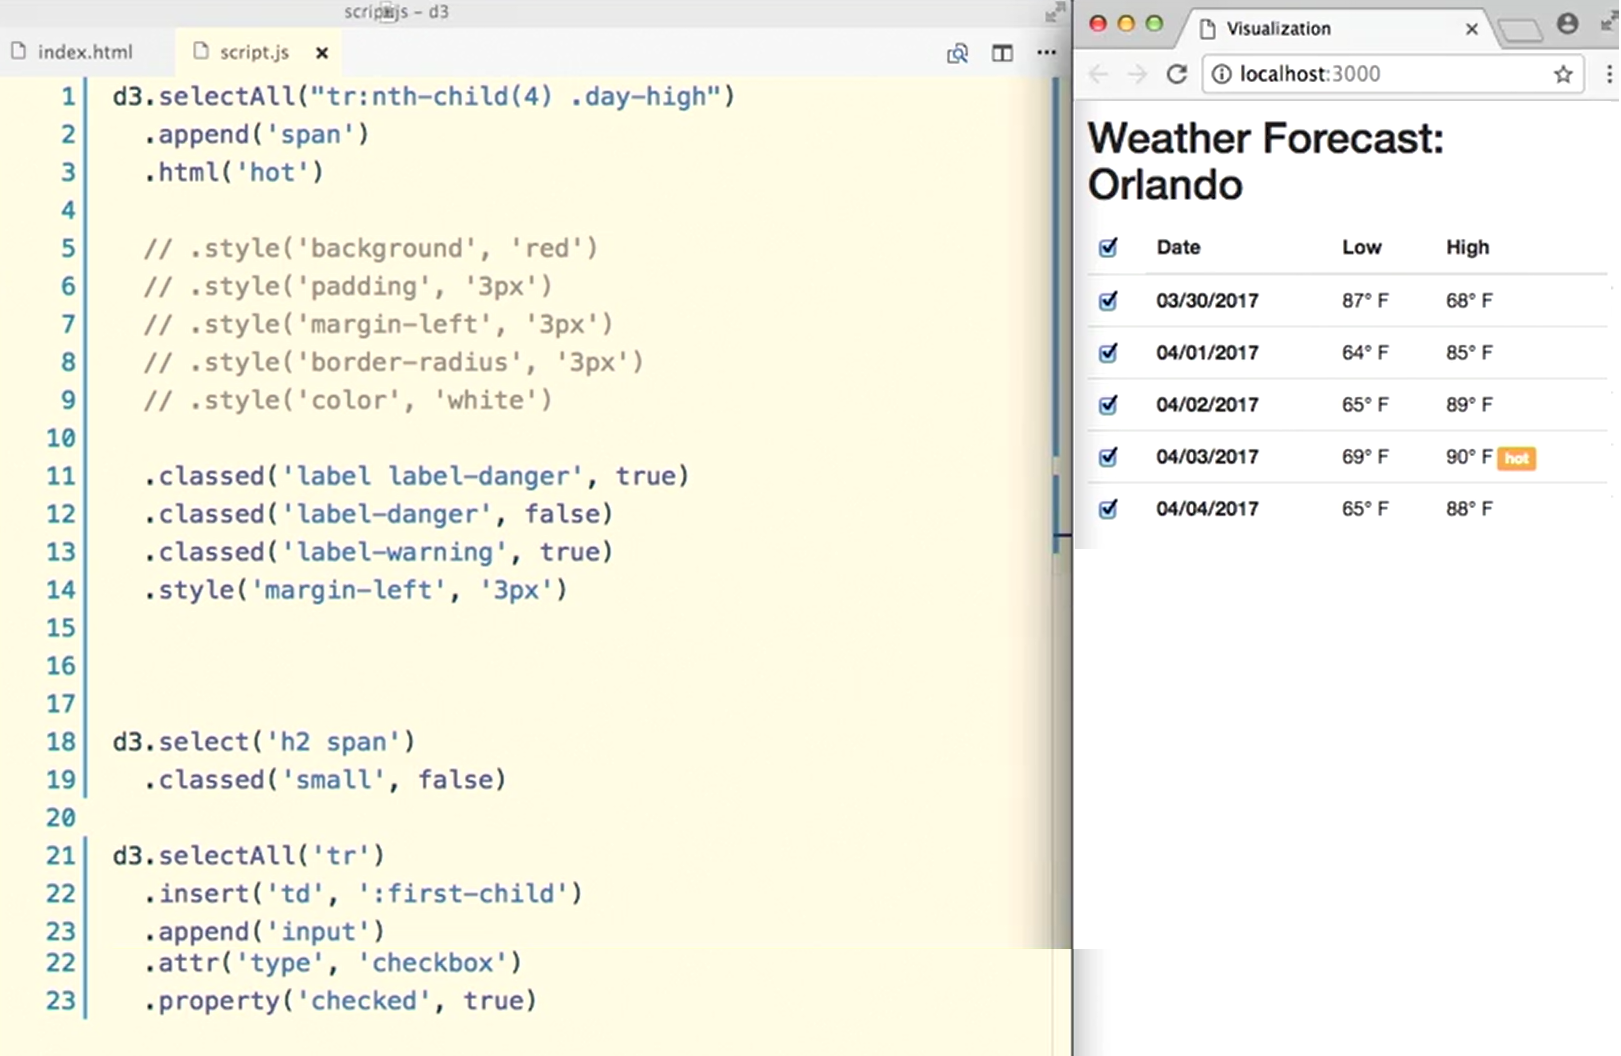
In addition to appending, inserting, and removing html elements, you can control any attributes within your selections. You can use this to style your selection with CSS, and changing styles is so important that D3 provides a few special methods to take care of just that. So lets take a look at what's available.
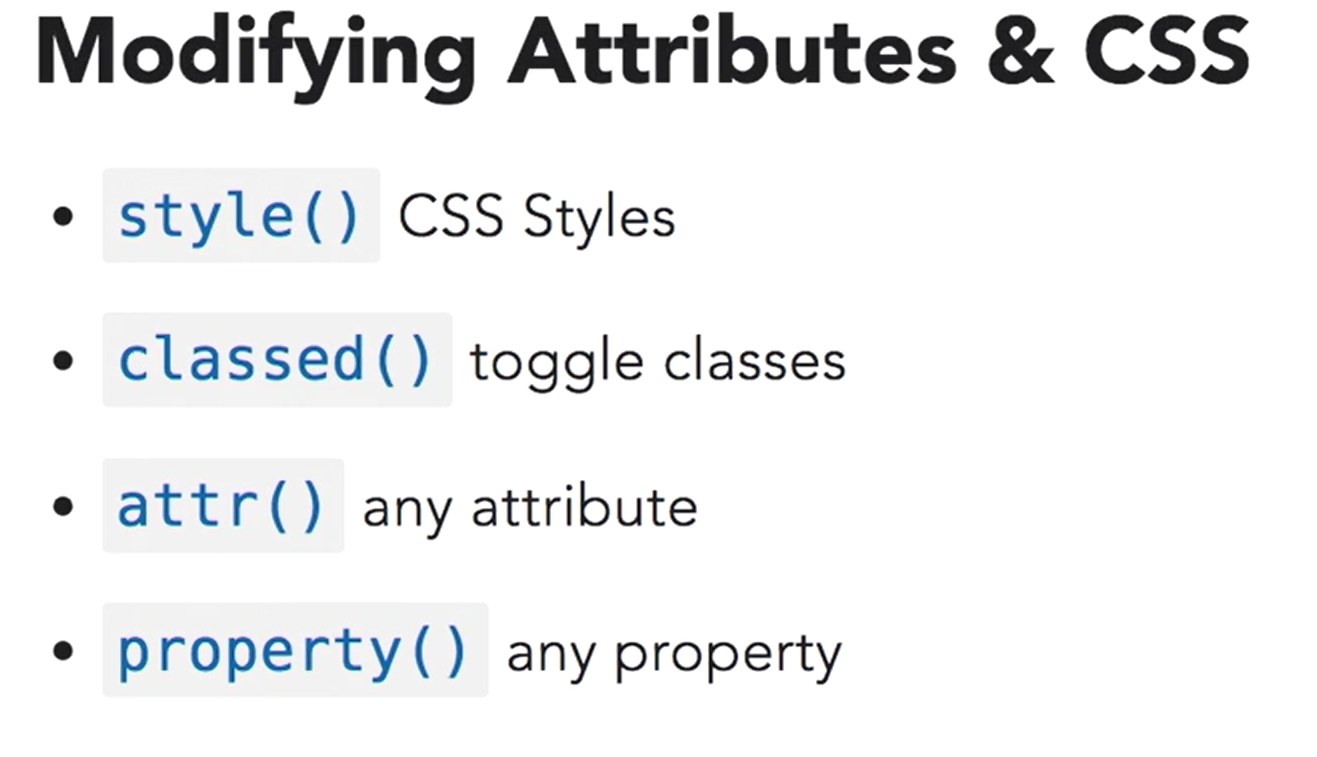
Now first of all if you just want to change certain style attributes you can use the style method. It gives you access to any CSS style and its the same thing as using the style attribute in HTML.
There's another method called classed and it allows you to toggle classes on and off if an element already has a number of classes you can ask for D3 to change just one of them and toggle it either on or off.
Attribute, or attr, lets you access any attribute not just classes or styles so its a little bit more flexible and there is a special method called property that allows you in the same way to access any property.
Most of the time its going to work just like attribute but there may be some instances in which you can only access properties through this property method instead of the attribute method.
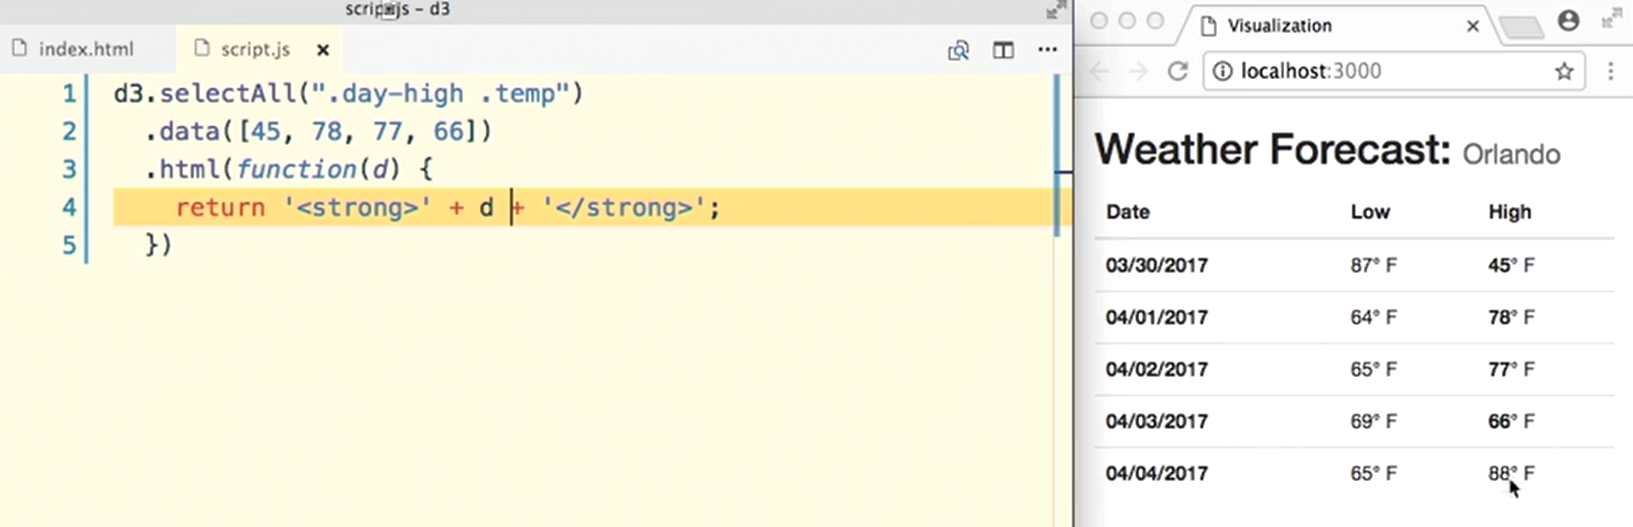
# Binding Data to the DOM
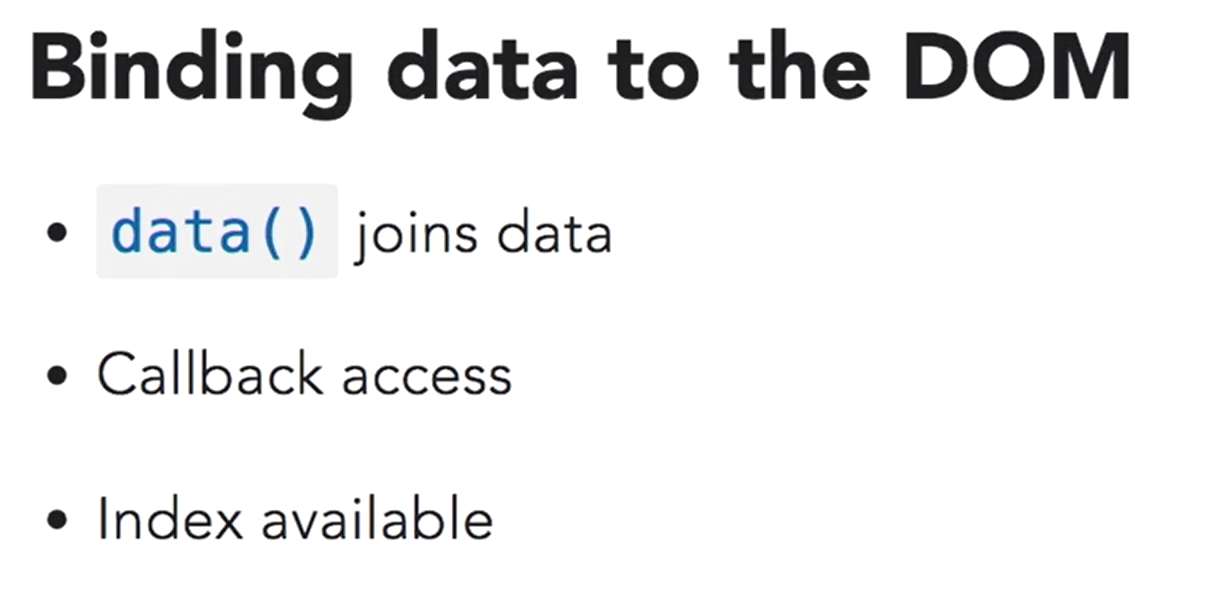
Now that we have a good understanding of how selections and attributes work its time to add some data to the mix. Now data can be added in a number of different ways. In this video I'm going to show you the simplest way to add information using the data method. The data method joins the current selection with some information that you provide. Now it takes an array of elements and the first piece of data in that array is going to be assigned to the first element in the selection and in the case of select all the second one is going to be assigned to the second element and any additional elements are going to be assigned to anything else in the selection. Now you can also pass the data to a function and this is called a callback in java script and that function can inherit the data passed down to it and do something with it. In addition to the data within this function you also have access to an index which you can use as well as the data to manage what d3 does with the selection or the information that you get back.
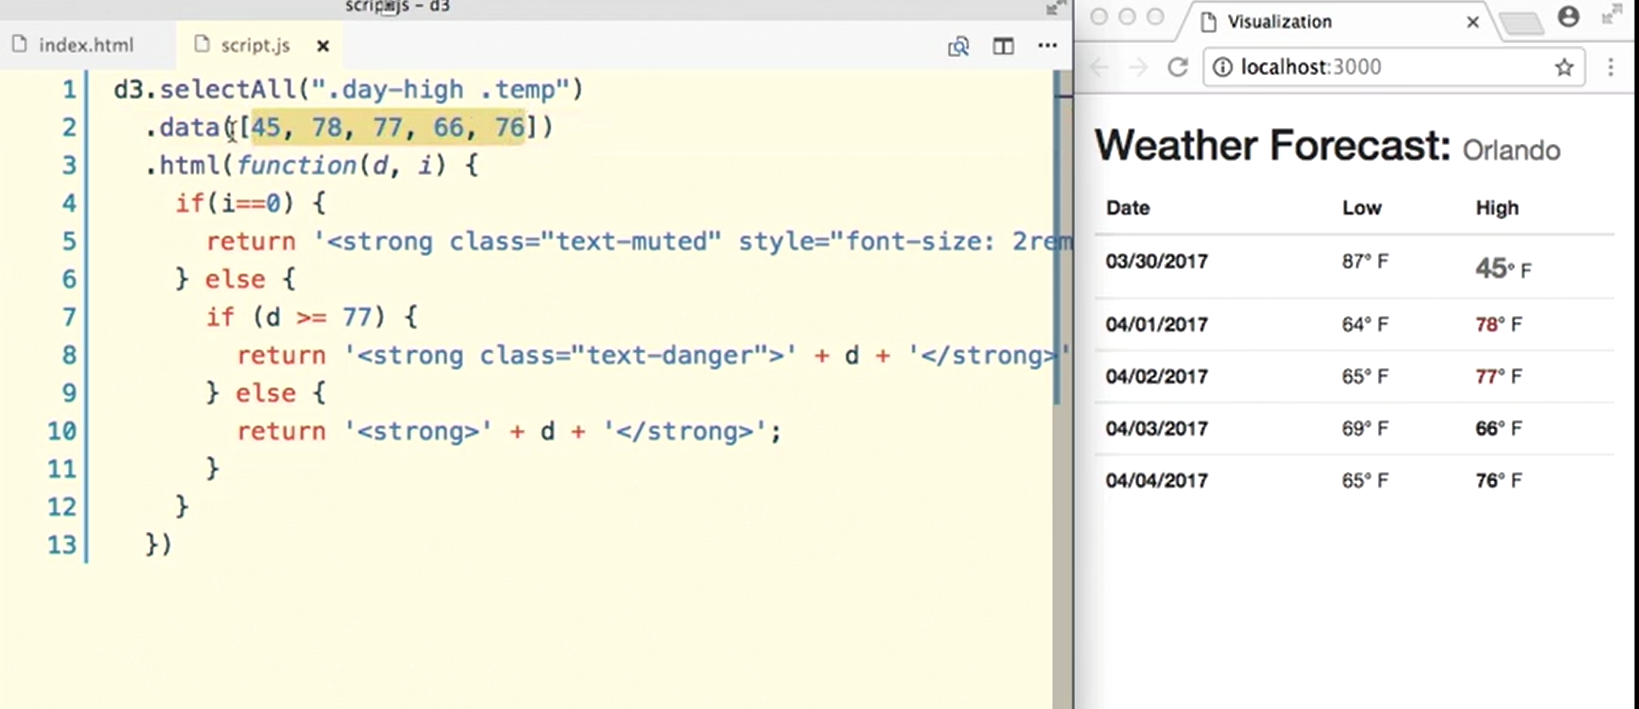
So we could say something like if this is the first element, if the index happens to be 0, remember java script is 0 indexed then I want you to return this but I'm going to add a class and this is going to be a bootstrap class of text. Mute it. lets go ahead and save that. You can see that the number here is a little bit grayer and then if you want to we can add a style tag here and save font size. We'll make this 2rem and then I'm going to save that and now it makes this text a little bit bigger. So that's pretty cool and then what we can do is say otherwise, then go ahead and return this and then we can do some other checks in here. We can say if the value of this data is greater than or equal to some number, so 76 sounds like, (typing yes maybe 77, sounds like its getting a little warm for my taste. So if the value of that number is greater than 77 then I'm going to make this class here text-danger (typing) and then I'll just do another else here and than otherwise this return the text by itself. so anything that's above 77 degrees, its going to make red right here. so that's pretty cool; we can use not just the data but also the index and the other thing to remember that's important is that d3 is going to pass this data along and its kind of smart. It sort of just replaces as many elements as you specify. If you don't specify an element its just sort of going to ignore things and then it allows you to modify that data or control how that data is displayed with these two extra variables, the data as well as the index.
# Creating subselections
So far we've been working with existing DOM elements. In a real project you usually create these elements programmatically. D3 lets you create a placeholder for these elements and then que up commands for them.
So lets take a look at how that works. First of all, the enter method changes the way that the data method works. Once you use enter, you're no longer appending things to the current selection, you're placing them into something D3 calls a Sub-selection.
These Sub-selections allow you to isolate elements we want to work with and then act upon them. Now, if you do need to exit a Sub-selection you can use the exit method
# Sub-selections:
- enter()
- Sub-selections
- exit()
And what we want to do is first define the data that we want to use. So I'm going to create a variable called mydata and I'm going to pass along as usual, an array into this variable. Now, if you want to you can create more complex data elements by using Objects. So instead of adding specific values here I can create an Object and the first one is going to have a property of date and then in here I'm going to add some dates. I'm also going to add a variable for the low temperature as well as the high temperature.
var mydata = [
    { date: '4/01/2017', low: 55, high: 78 },
    { date: '4/02/2017', low: 65, high: 83 },
    { date: '4/03/2017', low: 77, high: 90 },
    { date: '4/04/2017', low: 58, high: 78 },
    { date: '4/05/2017', low: 67, high: 92 },
]
2
3
4
5
6
7
Alright, once we have this data then we can target our selection. And another thing that you can do with D3 is actually add multiple selections.
So you can use the D3 method to select something and in here we can target the tbody element.
So that would be the main body of our table, where we want to insert the data. And then with this script we can target another selection by using another selection method.
var mydata = [
    { date: '4/01/2017', low: 55, high: 78 },
    { date: '4/02/2017', low: 65, high: 83 },
    { date: '4/03/2017', low: 77, high: 90 },
    { date: '4/04/2017', low: 58, high: 78 },
    { date: '4/05/2017', low: 67, high: 92 },
]

d3.select('tbody')
  .selectAll('tr')
2
3
4
5
6
7
8
9
10
So we can actually say go get the tbody and then find something called selectAll. And this is going to be a tr and is one of the interesting things about using the enter method.
So this is actually a little bit of time travel. We want to create some elements and then we want to insert things into those elements. So the first thing we need to do is actually create the element or refer to the element but that element doesn't actually yet exist. So this selectAll is selecting something that is not yet in this index, that html file. We're going to refer to it in just a minute with our enter command.
So then I'm going to pass along the data using the data method and pass it along mydata. And then I'm going to use the enter command here to enter this selection and then I'm going to append a tr.
var mydata = [
    { date: '4/01/2017', low: 55, high: 78 },
    { date: '4/02/2017', low: 65, high: 83 },
    { date: '4/03/2017', low: 77, high: 90 },
    { date: '4/04/2017', low: 58, high: 78 },
    { date: '4/05/2017', low: 67, high: 92 },
]

d3.select('tbody')
  .selectAll('tr')
  .data(this.mydata)
  .enter().append('tr')
2
3
4
5
6
7
8
9
10
11
12
So this is going to be the tr's that we are going to be inserting with the data that we're going to get from this data command.
So something weird is happening here and I want to point your attention to it. I'm appending these tr's but I'm also selecting them above. So you can see right here on this line I am asking D3 to select tr's that don't yet exist and I am actually appending those tr's right here.
So its a little bit of time travel and you just have to remember that you're going to make a selection on something that doesn't exist and then use the enter command to enter that selection or each individual tr. And then you have to make sure that you append the tr's so that they actually exist.
So lets keep on going. Then we can use any one of our functions. We'll go ahead and use the html function and pass along the data here. And so now we can do something with each individual tr that we created by using the append command and we select it by using selectAll.
var mydata = [
    { date: '4/01/2017', low: 55, high: 78 },
    { date: '4/02/2017', low: 65, high: 83 },
    { date: '4/03/2017', low: 77, high: 90 },
    { date: '4/04/2017', low: 58, high: 78 },
    { date: '4/05/2017', low: 67, high: 92 },
]

d3.select('tbody')
  .selectAll('tr')
  .data(this.mydata)
  .enter().append('tr')
  .html(function(d) {
      return '<th scope="row">' + d.date +
             '</th><td>' + d.low +
             '</th><td>' + d.high + '</td>'
  })
2
3
4
5
6
7
8
9
10
11
12
13
14
15
16
17
So what we want to do here is just return and this will just be sort of a normal series of table commands. So th scope is row here and then we'll refer to the date. So this variable d contains the data that we're getting from this data command. So we can use that and then plus, then use our date property. So each one of these will come up as a property under the data. Then lets go ahead and close that th and create a new td and we'll use the low temperature here. We will create another line here. You can put these all in one line if you wanted to. We'll close out the td and then open up a new one and into this new one we'll place the high temperature. And then we will close out the td.
<template>
    <body>
        <div>
            <table class="SubSelections">
                <thead>
                    <tr class="head">
                        <th scope="col" class="head-date">Date</th>
                        <th scope="col" class="head-temp-low">Low</th>
                        <th scope="col" class="head-temp-high">High</th>
                    </tr>
                </thead>
                <tbody>
                </tbody>
            </table>
            <div id="viz"></div>
        </div> <!-- container -->
    </body>
</template>

<script>

import * as d3 from "d3";

export default {
    data: function () {
        return {
            mydata: [
                { date: '4/01/2017', low: 55, high: 78 },
                { date: '4/02/2017', low: 65, high: 83 },
                { date: '4/03/2017', low: 77, high: 90 },
                { date: '4/04/2017', low: 58, high: 78 },
                { date: '4/05/2017', low: 67, high: 92 },
            ]
        }
    },
    mounted: function () {
        d3.select('.SubSelections tbody')
          .selectAll('tr')
          .data(this.mydata)
          .enter().append('tr')
          .html(function(d) {
            return '<th>' + d.date +
                   '</th><td>' + d.low +
                   '</td><td>' + d.high + '</td>'
          })
    }
}
</script>
2
3
4
5
6
7
8
9
10
11
12
13
14
15
16
17
18
19
20
21
22
23
24
25
26
27
28
29
30
31
32
33
34
35
36
37
38
39
40
41
42
43
44
45
46
47
48
| Date | Low | High |
|---|
This is definitely a simpler version of what we had done before but as you can see we can actually create all the data dynamically by using the enter command.
As long as we remember that we first have to select the element that we're going to append into the enter command.
# Understanding SVG graphs
# Drawing with SVG
Although D3 can handle and work with either HTML or SVG graphics, when you're working with D3, you'll often want to use SVG instead of HTML. SVG stands for Scalable Vector Graphics, and it definitely has some advantages over regular HTML.
Another really awesome thing about SVG is that you can access DOM element in SVG just like you would with CSS, and you can apply CSS-like styles. Now these aren't exactly like the CSS styles that you know, there's a few differences, but they work in exactly the same way, and as a matter of fact, if you already have an existing style sheet, you can add SVG commands into your regular style sheet. You can create complex SVG graphics with programs like Adobe Illustrator and then export them into your regular HTML pages.
Now the interesting thing about SVG graphics is that they are also scriptable, which means that you can program them to do things with JavaScript. That means that you can make portions of your SVG graphics respond to things like clicks or drags. You can attach events, animate them, and do pretty much whatever you can do with JavaScript within an SVG graphic. So learning how to work with SVG graphics in D3 is going to give you all the tools you need to not just display them, but also make them fully interactive.
# SVG
HTML shapes lacking
XML format
Style through CSS
Easy to create
Scriptable
# Understanding SVG primitives
Basic shapes in any graphic language are called primitives. So lets take a look at how we can create simple graphics using the basics of SVG primitives.
To create an SVG graphics you can use the SVG tag which looks just like any other HTML tag and just like with any other tag you can assign this tag attributes and typically for a graphic you specify the width and height of the canvas that you want to use with the particular graphic.
Just like with any other HTML tag we can add a style attribute which will let us control how this shape looks.
The main primitives for creating graphics in SVG are rect, of course, for rectangles, circle for ovals and circles then line and text as well as the polyline which creates polygons.
You can also group elements with the G tag and even assign any element an ID so that you refer to it later. Now one reason to do this is that if you want to reuse an element with an ID you can use the xlink:href attribute which lets you create an element that is a copy of another element.
Once you create that copy you can reposition it at a different place and also change some of its styles so lets go take a look at how this works.
# Creating Primitives
< svg > tag
Use style declarations
rect, circle, line, text, polyline
g creats groups
xlink:href create instance
<template>
    <div class="container">

      <h2>SVG Graphics</h2>

      <div id="viz">
          <svg width="600" height="400"
          style="background: #93A1A1">
          </svg>
      </div>

    </div><!-- container -->
</template>
2
3
4
5
6
7
8
9
10
11
12
13
SVG Graphics
Start adding primitives that will draw elements within the page so one of the primitives is the line primitive and this is a element that doesn't require a closing tab and because we're using XML when you create an element, like an HTML, you do an image and it doesn't have a closing version of the tag, you use a slash and this is sort of a self-closing element. So, without having this extra slash here, it would not be a properly formatted XML document. So you have to be a little bit more careful when you create SVG graphics and add this extra slash.
<template>
    <div class="container">

      <h2>SVG Graphics</h2>

      <div id="viz">
          <svg width="600" height="400"
          style="background: #93A1A1">
          <line x1="0" y1="200" x2="600" y2="400"
            style="stroke: #268BD2; stroke-width: 40px"/>
          </svg>
      </div>
    </div><!-- container -->
</template>
2
3
4
5
6
7
8
9
10
11
12
13
14
SVG Graphics
So as you can see, we're using properties that we're not used to seeing in HTML, we don't really use stroke width and stroke and that is one of the main differences between HTML and SVG. SVG has its own properties but you use the style attribute or if you want to you can put this in a separate style sheet or in an embedded style sheet, it doesn't really matter, it works in pretty much the same way.
<template>
    <div class="container">

      <h2>SVG Graphics</h2>

      <div id="viz">
          <svg width="600" height="400"
          style="background: #93A1A1">
          <line x1="0" y1="200" x2="600" y2="400"
            style="stroke: #268BD2; stroke-width: 40px"/>

          <rect
            x="200" y="100"
            width="200" height="200"
            style="fill: #CB4B19;"
            />

          </svg>
      </div>
    </div><!-- container -->
</template>
2
3
4
5
6
7
8
9
10
11
12
13
14
15
16
17
18
19
20
21
SVG Graphics
<template>
    <div class="container">

      <h2>SVG Graphics</h2>

      <div id="viz">

          <svg width="600" height="400"
          style="background: #93A1A1">

          <line x1="0" y1="200" x2="600" y2="400"
            style="stroke: #268BD2; stroke-width: 40px"
          />

          <rect
            x="200" y="100"
            width="200" height="200"
            style="fill: #CB4B19;"
          />

          <circle
            cx="300" cy="200" r="50"
            style=" fill: #840043"
          />

          <text
            x="10" y="390"
            font-family="sans-serif"
            font-size="25"
            fill="white">Hello SVG</text>
          </svg>
      </div>
    </div><!-- container -->
</template>
2
3
4
5
6
7
8
9
10
11
12
13
14
15
16
17
18
19
20
21
22
23
24
25
26
27
28
29
30
31
32
33
34
SVG Graphics
Triangle
<template>
    <div class="container">

      <h2>SVG Graphics</h2>

      <div id="viz">

          <svg width="600" height="400"
          style="background: #93A1A1">

          <line x1="0" y1="200" x2="600" y2="400"
            style="stroke: #268BD2; stroke-width: 40px"
          />

          <rect
            x="200" y="100"
            width="200" height="200"
            style="fill: #CB4B19;"
          />

          <circle
            cx="300" cy="200" r="50"
            style=" fill: #840043"
          />

          <text
            x="10" y="390"
            font-family="sans-serif"
            font-size="25"
            fill="white">Hello SVG</text>


          <g id ="triangle">
            <polyline
              points="10 35, 30 10, 50 35"
              style="fill: #F7B330"
            />
          </g>

          <use xlink:href="#triangle" x=30 y="0"/>

          </svg>
      </div>
    </div><!-- container -->
</template>
2
3
4
5
6
7
8
9
10
11
12
13
14
15
16
17
18
19
20
21
22
23
24
25
26
27
28
29
30
31
32
33
34
35
36
37
38
39
40
41
42
43
44
45
So another cool thing that you can do with SVG elements is refer to another element, so we could say I want to use another element and I'll use xlink:href and since we've given our group here an id of triangle we can actually refer to that in here so we'll say we want the element with an ID of triangle, right, and then we'll specify a different position for this so position 30 and zero and lets go ahead and self-close this use link here, I'll save it, and you can see that there's another triangle now, we didn't have to, sort of, do this entire group over again. We're just referring to that same element and then positioning it at a different place. So that's a great way of saving yourself some drawing commands.
SVG Graphics
If you know HTML, drawing things with SVG is really not a big deal. The main thing to learn is the right tags, attributes, and special styles.
# Drawing SVG graphics with D3
So the way that you do this is pretty simple, you create an element and then you target that element by using D3's selection methods.
Once we have that element, you can use methods like append or insert to add items into that element.
So you add an SVG element and then inside that, you can add additional elements and then use the attribute methods or the style methods in D3 to control how those elements look.
Creating SVGs
- Target DOM
- append() elements
- attr(), style(), etc
<template>
    <div class="container">

      <h2>SVG Graphics</h2>

      <div id="vizD3"></div>

    </div><!-- container -->
</template>

<script>

import * as d3 from "d3";

export default {
    mounted: function () {
        d3.select('#vizD3')
          .append('svg')
            .attr('width', 600)
            .attr('height', 400)
            .style('background', '#93A1A1')
          .append('rect')
            .attr('x', 200)
            .attr('y', 100)
            .attr('height', 200)
            .attr('width', 200)
            .style('fill', '#CB4B19')

        d3.select('#vizD3 svg')
          .append('circle')
            .attr('cx', 300)
            .attr('cy', 200)
            .attr('r', 50)
            .style('fill', '#840043')
    }
}
</script>
2
3
4
5
6
7
8
9
10
11
12
13
14
15
16
17
18
19
20
21
22
23
24
25
26
27
28
29
30
31
32
33
34
35
36
37
SVG Graphics
So if you want to add another item to the SVG now, well you can't really do an append command because this is going to append this element inside the rectangle and that wouldn't show.
So what we actually have to do is just do a different selection.
So sometimes you do have to sort of go outside the selection so you can't just append everything because every time you append, you sort of go inside the element that you are in.
So any other graphic we put in here will just be a repeat of all of these different commands.
D3 does get more powerful when you can combine data to create graphics. We'll take a look at that in the next video.
# Creating a simple SVG bar chart
Alright so its time to put everything we've learned into practice by creating a simple bar chart that uses data as well. So as you can see my index at HTML is back to just being pretty simple with a div that has an ID of viz. Right now in everything we do we'll be inserted into this div. My script file is completely empty. So I'm going to start off by creating a variable called bar data. And then setting that to an array with some simple values here. Now lets go ahead and create another set of variables that we can insert into our graphic. So we'll create a variable I'll call height, and that's going to have the height of the SVG graphic and some other variables as well. So the bar width variable will be the width of our bars and the offset is how much space in between. So first we need to start off by using d3 to select our element. So since there's only one element to select, we will target it like this using the ID of viz and immediately we'll go ahead and append a SVG graphic. And then inside that we will create some attributes. So attribute width, I'll set that to the width that we generate it above in that variable. Do the same thing with the height, just set it to the height variable, and then add the style that sets the background color. So that creates our graphic with the proper background, just like we did before. And now its time to start using our data. So what we're going to do here is do a select all. So we're going to use the enter with the data attribute. So first we have to select the elements that we're going to be creating, they're going to be a series of rectangles. And then we have to call the data attribute with our bar data and then we'll use the enter command and append the rectangles that we're calling. So remember we are selecting rectangles before they exist using this data that we are generating up here. And then with the enter command, we're going to append all of the rectangles that we're doin' here. So a series of bars will be just a series of rectangles that we're going to be generating with our data. And so in here we can actually start styling these individual bars. So I'll say fill. Alright so now we need to set an attribute for the width and this is going to be set to the bar default the width which we call bar width here. So they're all going to be the same width. And then here's where it gets sort of interesting. We'll set up another attribute, and for the height of each one of the different elements, this is going to use a call back with our data, and just return that data. So if we save this you'll see that we actually have all of the bars, but they're all the same color, and they're sitting right on top of eachother. So that's why it looks like a single bar. That means that we need to also set something for the X position. And for this one we will also need the index and we're going to return the index times our width plus the bar offset. And when you save that you can see that they all kind of appear next to each other. They have the offset in between, and they're all that default width. So we're getting something now. If you do want to align them to the bottom, we can add another attribute here for the Y position. Again a call back, and return the height minus the data so that now it aligns to the bottom. So the reason that its by default going to align to the top is, the weird Y coordinate system that happens with computers. And we're used to seeing a coordinate system that starts with 00 position on the bottom left, but computers have a coordinate system that has a 00 on the top left, and that's why we have to reverse things. So as you can see this is a pretty simple way of creating a graphic by using everything that we've learned so far. Combining our use of data as well as selections, attributes and style, to create a very simple looking bar chart. We're going to improve on this in the next chapter.
<template>
  <div class="container">

    <h2>SVG Graphics</h2>

    <div id="vizBar"></div>

  </div><!-- container -->
</template>

<script>

import * as d3 from "d3";

export default {
    mounted: function () {
      var bardata = [20, 30, 45, 15];
      var height = 400,
          width = 600,
          barWidth = 50,
          barOffset = 5;

      d3.select('#vizBar').append('svg')
        .attr('width', width)
        .attr('height', height)
        .style('background', '#C9D7D6')
      .selectAll('rect').data(bardata)
        .enter().append('rect')
        .style('fill', '#C61C6F')
        .attr('width', barWidth)
        .attr('height', function(d) {
          return d;
        })
        .attr('x', function(d, i) {
          return 5+i*(barWidth + barOffset)
        })
        .attr('y', function (d) {
          return height - d;
        });
    }
}
</script>
2
3
4
5
6
7
8
9
10
11
12
13
14
15
16
17
18
19
20
21
22
23
24
25
26
27
28
29
30
31
32
33
34
35
36
37
38
39
40
41
42
SVG Graphics
# Adding a linear scale
A scale is a method that allows us to redefine data so that it fits a certain range of values.
The simplest type of scale is called the Linear Scale.
It has a method called scaleLinear.
its also known as a continuous scale because it maps a serial set of input values to output values.
We can use that in our table to make our data grow to fit a specific range.
Now it needs two things: First is the domain, which you can use by using the domain method. And that will be an array of values that you feed to your scale. Now it defines the original values that you're going to modify. So in this case, this will be pretty much our data.
The range is another set of values that you feed in an array to the linear scale. This represents the values that we want to scale our data to.
We can also use some statistical methods to parse our domain for information that we need. In this case, we're going to need to figure out which is the maximum value in our data so that we can take all the other values and scale everything according to that maximum value..
https://github.com/d3/d3/blob/master/API.md#statistics